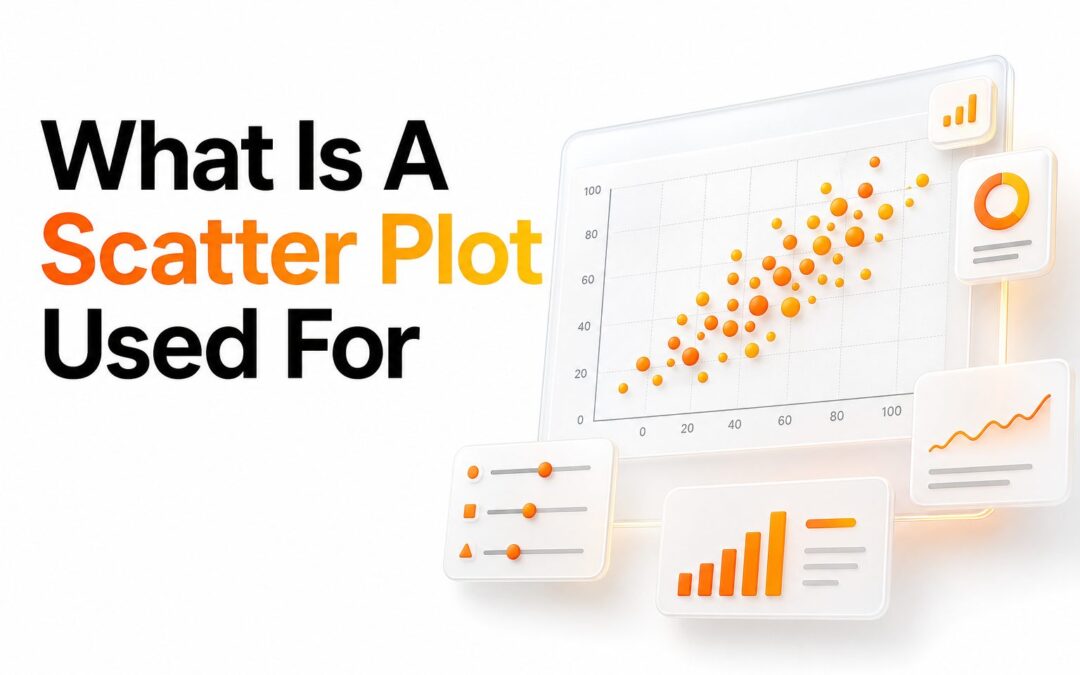
 A scatter plot is used to show the relationship between two numerical variables. Each point on the chart represents one observation, with one value placed on the horizontal axis and another value placed on the vertical axis. The main value of a scatter plot is visual...